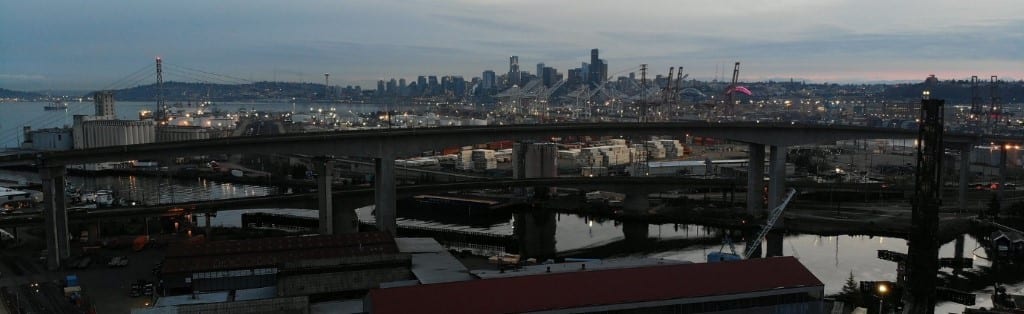
 Downtown Seattle and the West Seattle High-Rise Bridge. Photo Credit: SDOT.
 Summary
- As part of our steadfast commitment to clear communication and transparency, we’re excited to share the West Seattle High-Rise Bridge Cost-Benefit Analysis (CBA) and its appendices with you.
- The West Seattle Bridge Community Task Force will meet Wednesday, October 21 at 12 PM to review and discuss the CBA. You can watch this meeting live using this link.
- The CBA is a dense, technical document, so we’ve provided a “Reader’s Guide” in this blog.
- The Reader’s Guide covers: key takeaways, objective of the CBA, the six repair/replace alternatives the CBA studied, how they were assessed, and how each fared.
- We’re also excited by the potential of a new replacement alternative not included in the CBA. Details of this new alternative will be shared with the Community Task Force (CTF) on Wednesday.
- We’ve been discussing the CBA for a while now. Take a look at our past blogs for more information and background on this process to-date.
As part of our steadfast commitment to clear communication and transparency, we’re excited to share the West Seattle High-Rise Bridge cost-benefit analysis (CBA) with you.
The CBA has been shaped by input from the neighborhoods most acutely impacted by the West Seattle High-Rise Bridge closure, our West Seattle Bridge Community Task Force (CTF), and leading bridge experts through our Technical Advisory Panel (TAP). Its components have been a central focus of CTF meetings, and four months of feedback and careful review from our TAP.
A recording, summary, and presentation of each Task Force Meeting is available on our blog.
In the coming weeks, Mayor Durkan will share direction on the path forward that provides the safest, fastest solution to reconnect West Seattle, with the highest degree of certainty and lowest level of impact to communities in and around the Duwamish Valley, the city, region, and state. This CBA will play an important role in that decision, along with input from the TAP, the CTF, and SDOT’s leadership, as well as funding options and other external factors at the city, state, and federal level.
Though it has taken time to calculate and compile this comprehensive Cost-Benefit Analysis, we’ve not passed up a single opportunity to move with urgency and expedite efforts to restore travel across the Duwamish.
Since the closure of the West Seattle High-Rise Bridge, we’ve worked to simultaneously advance all efforts to efficiently pursue both a repair or replace scenario, while mitigating traffic and environmental impacts on the ground. By advancing all pathways at once, we have lost no time while we carefully and thoroughly assess which avenue – repair or replace – provides the safest, most certain outcome for the region over the long-term.
Is there a “Rapid Replacement” option, and is it reflected in the CBA?
HNTB, whom we brought on board to design an eventual replacement of the West Seattle High-Rise Bridge, has developed a superstructure replacement concept similar to Alternative 4. This proposal has the potential to expedite the safe and conservative timeline used for replacement construction in the CBA. We’re still at the early stages of vetting this alternative, so it’s not possible to do an “apples to apples” comparison with the CBA’s Alternative 4.
Because we think this idea has merit, however, we think it’s important to discuss the potential ways we could accelerate a replacement structure at the same time as we present the final CBA. It’s important to keep in mind that the CBA could only capture several options amongst many, these options are only at preliminary design, and there are many ways to improve upon the baseline templates used in the CBA, including the new “rapid span replacement” proposal from HNTB.
While many questions remain about the risks and opportunities this new alternative presents, it does provide a real possibility for moving more quickly toward replacement than the “restore travel by 2026” assumption reflected in the CBA. We’ve worked hard to review this proposal as quickly as possible with our own internal experts in recent days, have just had the opportunity to get initial independent feedback from our Technical Advisory Panel late last week, and will now share this framework with the Task Force tomorrow, along with some of the CBA’s findings. This is a timeline much faster than SDOT typically shares early designs with the public, but as part of our commitment to clear communication and transparency, we want to ensure the public has all of the key considerations at hand as the Mayor prepares to make this important decision in the coming weeks.
At nearly 90 pages, and several hundred pages of appendices, the CBA is a dense, technical document. To help you navigate and put the report in context, we’re providing a brief “Reader’s Guide” below.
For full, technical discussions of the CBA, please review recent CTF meetings and blogs (we recommend this blog that discusses our initial CBA plan and process). In particular, Greg Banks of engineering firm WSP outlines in detail all cost-benefit components and underlying calculations starting at minute 50 of Meeting #8 on September 9, 2020. In Meetings #9 and #10, Greg Izzo, West Seattle Bridge Capital Program Manager at SDOT, answers many of your questions regarding the CBA.
– READER’S GUIDE –
West Seattle High-Rise Bridge Cost-Benefit Analysis
Alternatives 2 and 4 rise to the top, have similar total ownership costs, and other key CBA considerations and takeaways.
The CBA doesn’t give clear results because of the preliminary level of design for all alternatives, and we don’t have all the information about how the bridge responds to final stabilization measures or a full thermal cycle.
Key takeaways are:
Since the emergency closure of the bridge on March 23, 2020, SDOT has advanced all possible pathways to restore this critical transportation connection. The bridge stabilization work currently underway preserves public safety and enables thoughtful consideration of a range of alternatives. This allows us to consider all options without losing time, so we can quickly restore capacity across the Duwamish River to move people and goods.
The CBA doesn’t intend – and wasn’t intended to – yield a specific decision on any alternative. It’s one tool amongst many that should help inform a comprehensive consideration of the best path forward. Just like the CBA is itself one consideration among many, each component within the CBA tells only one part of the story, and considering a single data point in isolation and without broader context can lead to misleading narratives.
The CBA considers five final alternatives – shoring, rehabilitation, superstructure replacement, bridge replacement, and an off-alignment immersed tube tunnel – that are each scored from a performance perspective across ten attributes shaped, by in large by the CTF.
When doing an apples-to-apples comparison of each of the five alternatives, the CBA found that:
- Alternative 1, the shoring concept, and Alternative 6, the immersed tube tunnel concept, performed poorly overall.
- Alternatives 2, 4, and 5 performed similarly, but Alternative 4 (superstructure replacement) was the overall best performer.
- The results from the performance phase of the CBA indicate that, while rehabilitation and bridge replacement are both viable options, bridge replacement alternatives offer slightly better performance (with the exception of a tunnel replacement).
- Any alternative that reduces the time it would take to restore traffic (faster than 2024-2026) will have a higher score for the environmental, equity, business and workforce impacts, and mobility impact attributes.
The CBA is a helpful document in its ability to make clear that – after factoring in dozens of attributes and measurables – two of the greatest differences to consider in a “repair” or “replace” scenario are cost and time.
Cost:
- Costs listed in the analysis for each alternative are rough-order-of-magnitude costs only to help with early decision making and screening purposes, with the concepts only at preliminary design. SDOT begins to feel comfortable with project cost estimates at around 30 percent design.
- While the costs are expressed as precise numbers, rather than SDOT’s preferred method of using wide cost ranges, this is to provide consistent evaluation across the alternatives, and these conceptual costs should not be interpreted as detailed cost estimates. As alternatives and approaches evolve, the corresponding cost estimates will too.
- The total ownership costs – a combination of capital costs and life cycle costs – for Alternatives 2 (repair) and 4 (superstructure replacement) are similar, at roughly $1 billion over time.
- While the upfront constructions costs (design, demolition, construction, contingencies) for Alternative 2 (repair) are much lower than Alternative 4 (superstructure replacement), at roughly $50M versus $380M, the total operations and maintenance (monitoring, inspection, standard maintenance) and repair and rehabilitation costs (lump sum allowance for future replacement if repair chosen and/or future strengthening if replacement chosen) are greatest for the Alternative 2 (repair) pathway.
- Alternative 2 operations and maintenance costs are $40.5M, nearly double that of Alternative 4 at $22.1M. Repair and rehabilitation costs for Alternative 2 are $1,279.8M versus $247.3M.
- The higher operations and maintenance costs for Alternative 2 (repair) is significant because the City has not collectively solved the challenge of adequately funding our bridge maintenance and operations and this would have to be resolved in parallel with a repair pathway. An inability to do so could potentially come at the expense of other bridges or assets’ operations and maintenance under SDOT’s charge.
- The higher repair and rehabilitation costs for Alternative 2 (repair) is notable because the funding partners that may be needed for the upfront cost of a repair may not be interested in investing further resources when the eventual replacement is needed.
- We estimated operations and maintenance and repair and rehabilitation costs over a 79-year span – from 2021 to 2100.
Time:
- We all share a desire to deliver the safest, fastest solution to reconnect West Seattle, which also provides the highest degree of certainty and lowest level of impact to communities in and around the Duwamish Valley, region, and state.
- The repair pathway has the potential to be the fastest, while also providing a higher level of uncertainty that the pathway will be successful when compared to the selection of a replace pathway. Alternative 2 (repair) could restore travel across the Duwamish as quickly as 2022. It’s also possible, however, that the repair pathway could lead to another unplanned closure sometime in the future, and a mandatory shift towards replacement.
- Determining the likelihood of if and when (the difference between a few years to 40) the repaired bridge would reach the end of its service life would require a probabilistic determination study, a process that could add an additional several months to this timeline.
- What’s certain is that in the event of a repair pathway, the bridge would need to be closed at some point in the future for an eventual replacement.
- The replace pathway that rises to the top in the CBA, Alternative 4 (superstructure replacement), would take longer than the repair pathway. Alternative 4 anticipates restored travel by 2026. The far end of that estimate is a very long way from 2022. At the same time, the construction timeline used in the CBA is a very conservative, linear approach that has ample room for improved efficiency and condensed delivery.
In short, Repair vs. Replace boils down to:
- Repair options have a better cost-to-performance ratio, lower capital costs, and higher maintenance costs. We could return to using the bridge sooner than replacement options, but ultimately would have to close the bridge in the future for an eventual replacement, although an unplanned closure would have greater impact. Repair options scored lower on attributes overall, especially the key seismic/safety attribute. Success of repairs depends on the bridge’s reactions to current stabilization efforts. There is a risk that the repaired bridge wouldn’t last 40 more years – its remaining design service life.
- Replacement options we examined in the CBA – only a few of the many options available – performed better on key attributes, and have higher capital costs and lower maintenance costs for Alternatives 4 and 5. We used conservative construction durations to determine that it would take longer to return to full traffic, but we wouldn’t need to close the bridge again to replace afterwards. Success doesn’t depend on bridge reactions to current stabilization, and there is a lower risk the new structure wouldn’t reach its 75-year lifespan.
Why did SDOT conduct the CBA? What was the objective?
The objective of the CBA is to evaluate the benefits, drawbacks, and rough-order-of-magnitude (ROM) costs of multiple alternatives (or options for the High-Rise Bridge) to determine whether it would be in the City’s best interest to repair the existing bridge or replace it. The CBA examines three different types of options (shoring, rehabilitation (or “repair”), and replacement), composed of six different broad alternatives that have been developed based on concept-level design work and the continued monitoring of the bridge.
What are the six different alternatives under the categories of Shoring, Repair, and Replacement?
The CBA calculated initial capital costs, life-cycle costs, and risks for six alternatives along a shoring-repair-replacement spectrum to illustrate the benefits and drawbacks of rehabilitation and replacement alternatives.
The CBA began with five alternatives, all of which were on-alignment and fit the same grade and profile as the current bridge. In response to community feedback, we adopted a sixth alternative – an immersed tube tunnel (ITT). We also eliminated the third alternative, a partial superstructure replacement, from consideration, as it was determined to not be a feasible, low-cost option for rehabilitation.
The six alternatives are:
1 | Temporary Shoring to Restore Live Load (shoring)
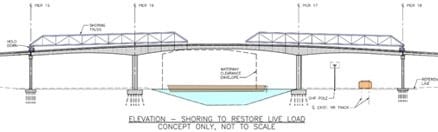
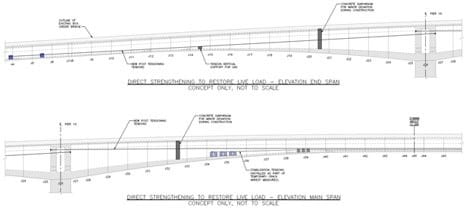
2 | Direct Strengthening to Restore Live Load (repair)
3 | Partial Superstructure Replacement to Restore Live Load (partial replacement)
[eliminated due to feasibility issues]
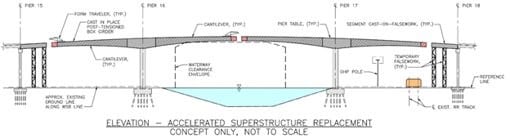
4 | Accelerated Superstructure Replacement (replacement)
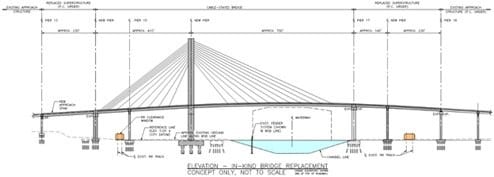
5 | Accelerated Bridge Replacement (replacement)
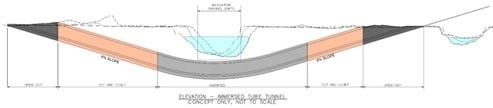
6 | Immersed Tube Tunnel (replacement)
How did the community, CTF, and TAP input shape Cost-Benefit outcomes?
The community, through the CTF, was able to identify and then weight which values and priorities should drive the outcomes reflected in the cost-benefit analysis. These values and priorities are called “attributes”.
This process enabled us to create a list of ten attributes, and within each attribute are a set of measurables. Together, they help assess the performance of each of the six alternatives (in other words, which alternatives rank highest for each attribute).
This was an iterative and collaborative process, where community voices and leading experts shaped the list of attributes and the measurables tracked within each of them. For example, during Workshop No. 2, SDOT and WSP decided to make “Equity” an explicit attribute, in response to early community feedback. During the September 9 CBA presentation to the CTF, members of the CTF raised concerns that the CBA was not adequately capturing long-term workforce impacts, so we added another measurable (or way to measure) Business and Workforce Impacts.
The list of attributes are:
- Bridge Maintenance, Inspection, and Operations
- Constructability
- Environmental
- Equity
- Forward Compatibility
- Funding Opportunities
- Business and Workforce Impacts
- Mobility Impacts
- Multimodal Impacts
- Seismic/Safety
Once we identified the ten performance attributes and how they are measured, SDOT, the TAP, and the CTF independently weighted each attribute against the others. The highest-ranking attributes were Mobility Impacts, Seismic/Safety, and Constructability, so they were given the most “weight” for the next step of the CBA to calculate overall performance of each alternative.
What did the attribute scoring tell us?
The three schemes – shoring, repair, and replacement – encompassing five final alternatives – shoring, rehabilitation, superstructure replacement, bridge replacement, and an off-alignment tunnel – were scored across ten attributes and more than four dozen measurables.
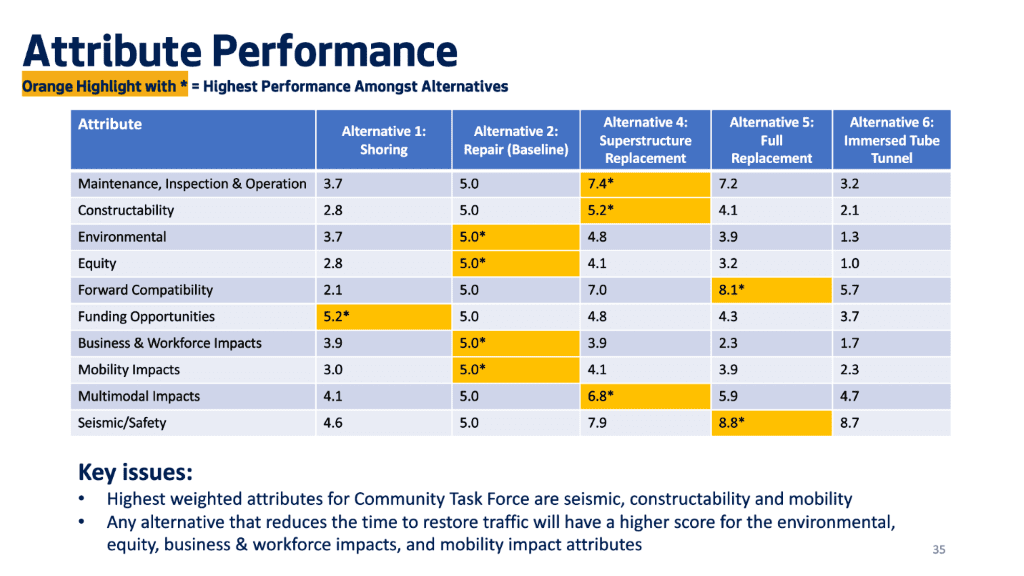
The below table shows how each alternative fared across each attribute relative to Alternative 2, the baseline.
We chose Alternative 2 to serve as the baseline against which other alternatives were scored. Alternative 2 was given a baseline score of “5”, and if another alternative performed better for that attribute, it received a higher score, and vice versa. For example, for the Constructability attribute, Alternative 4 scored slightly better (at an average of 5.2) than Alternative 2, and Alternative 1 (at an average of 3.7) was considered to perform worse than Alternative 2.
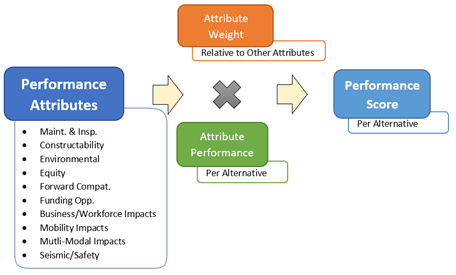
This equation shows how we developed overall performance scores for each alternative. We multiplied each alternative’s attribute score by the attribute weighting and then added these numbers together to determine the overall performance score.
This showed us that:
- Alternative 1, the shoring concept, and Alternative 6, the immersed tube tunnel concept, performed less well overall.
- Alternatives 2, 4, and 5 performed similarly, but Alternative 4 (superstructure replacement) was the overall best performer after attribute weighting was factored in, with Alternative 5 not far behind. The CBA calculated overall performance by multiplying the average performance scores above by the attribute weight.
- The results from the performance phase of the CBA indicate that, while rehabilitation and bridge replacement are both viable options, bridge replacement alternatives offer slightly better performance (with the exception of a tunnel replacement).
- Any alternative that reduces the time it would take to restore traffic (faster than 2024-2026) will have a higher score for the environmental, equity, business & workforce impacts, and mobility impact attributes.
Can you tell me more about the analysis of each alternative?
Yes. The table below outlines our key takeaways and important information about timing, cost, and lifespan of each option.
Ultimately, cost is a key element of the CBA. Annual operations and maintenance costs vary between the options, and securing funding for those costs in an ongoing challenge, especially for the repair pathway. Examples of operations and maintenance costs include: frequent and specialized inspections, painting/UV protection, and ventilation & fire protection, among others. Total and upfront costs are shown in the table below.
| Option | Cost | Risks |
| Alt. 1 | Shoring could restore partial traffic by late 2024 and last about 5 years. | $1,558.9 million total; $103.5 million upfront | This is a complex and costly option with a short lifespan and long construction timeline. It wouldn’t restore full travel capacity and would ultimately require replacement and closing the bridge again. |
| Alt. 2 | Repair could restore full traffic by 2022 and last between 15-40 years (with risks). | $916 million total; $47 million upfront | We are not confident in how long the repaired bridge would last – it has already belied the expectations set when it was built. It could be difficult to secure maintenance funding on an annual basis. This option had a lower seismic performance compared to replacement alternatives. This alternative would ultimately require replacement and closing the bridge again. |
| Alt. 4 | Superstructure Replacement could restore traffic by 2026 and last 75 years. | $1,005.7 million total; $383.1 million upfront | There would be significant impacts on mobility with this option, which requires a longer bridge closure. Funding a larger up-front capital cost could be challenging, and permitting and regulatory issues could impact the timeline. Any opportunity to condense schedule would improve Alternative 4’s performance and reduce impacts on mobility. |
| Alt 5 | Full Replacement could restore traffic by 2026 and last 75 years. | $1,542.7M total; $564.7M upfront | Similar to the above, there would be significant impacts on mobility with this option, which requires a longer bridge closure and funding a larger up-front capital cost could be challenging. |
| Alt 6 | Immersed Tube Tunnel could restore traffic by 2030 and last 75 years. | $2,823.6M total; $1,992.1M upfront | This option presents environmental challenges because dredging the bottom of the Duwamish River could release hazardous materials, and an off-alignment alternative would require substantial right-of-way acquisition and relocation of existing on- and off-ramps. Similar to the above, there would be significant impacts on mobility with this option. Securing funding would be challenging, there would be major impacts to Harbor Island, and a tunnel would be a unique asset for SDOT to maintain. |
What if I don’t agree with your assumptions?
The CBA is based on a number of factors and assumptions so we could make a consistent comparison across alternatives. Because we recognize that there are many factors that remain uncertain at this point, the CBA does contain a series of “sensitivity studies” in Section 6. These studies assess the potential for different CBA outcomes under a set of different assumptions, and show how even slight variations in assumptions can yield different CBA outputs. The likelihood of different scenarios and the potential risk tolerance of different alternatives help guide the use of the CBA in the decision-making process.
This week – on Wednesday, October 21 – we will hold another meeting with the West Seattle Bridge Community Task Force. Here, we will share and discuss the results of the CBA. Watch that meeting live here at 12 PM on October 21.
In response to the CBA and the dedicated work of the CTF to date in helping us shape the alternatives, we look forward to feedback that can help inform Mayor Durkan’s decision on which pathway to pursue.