In December 2019, Mayor Durkan announced a series of steps that the city is taking to make our streets safer and achieve our Vision Zero goal of ending traffic deaths and serious injuries on city streets by 2030.
These steps include reducing speed limits to 25 mph across the city, changing traffic signals to let pedestrians walk first, adding traffic cameras to school zones and intersections, engineering changes to create safer streets, creating a new crash review task force, and launching additional traffic safety education and enforcement tactics.
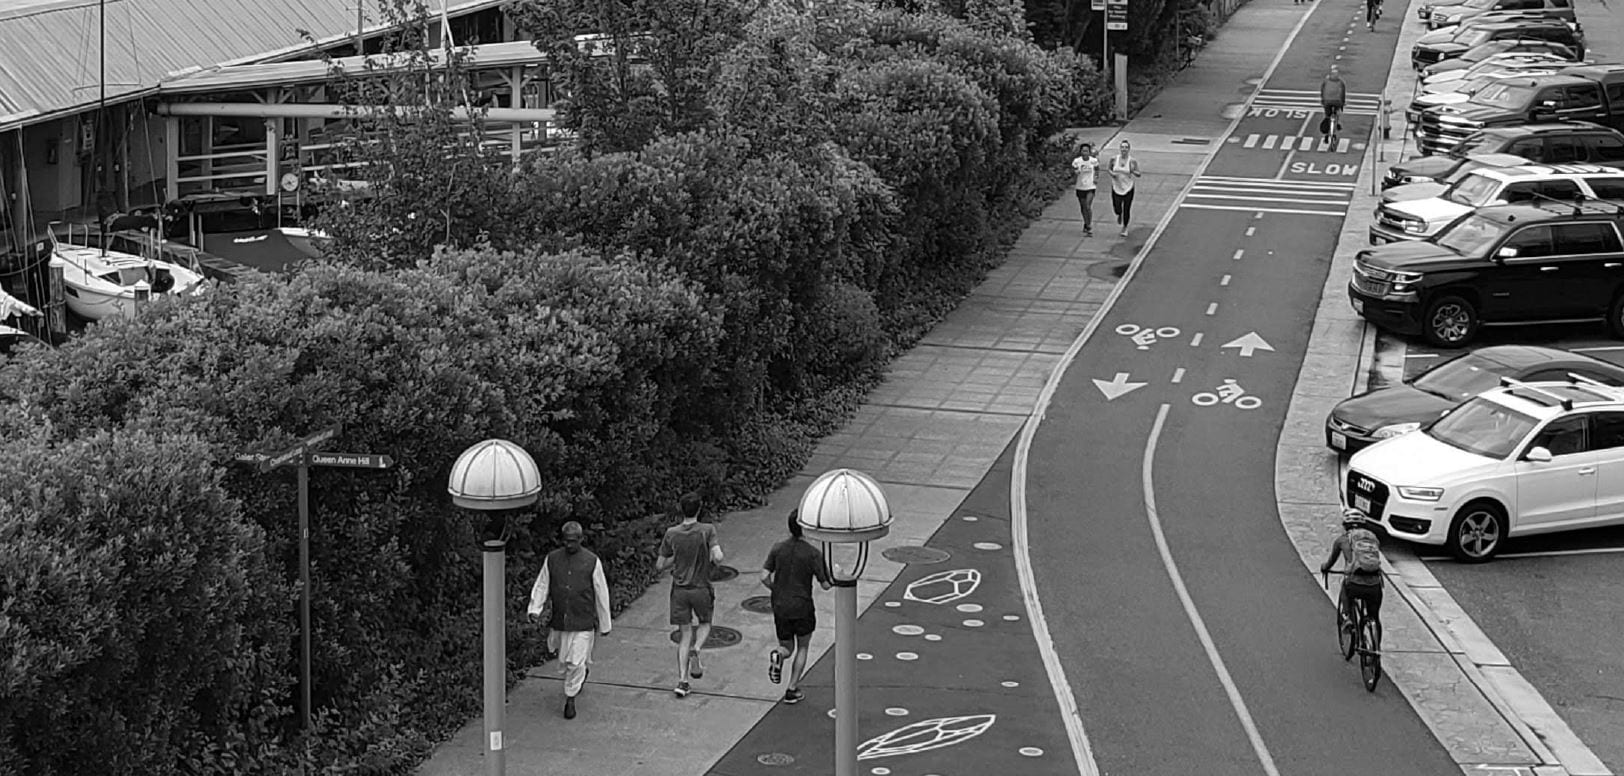
Bicyclists & pedestrians are our most vulnerable roadway users and make up a disproportionate share of vehicle-related deaths & serious injuries every year.
We initiated the Bicycle and Pedestrian Safety Analysis in 2015 to look at bicycle and pedestrian incident trends. We use findings from these analysis to proactively make safety enhancements across the city. This ground breaking approach helps us prioritize locations, anticipate issues, and make decisions informed by data.
In 2016 we released an initial phase 1 analysis that laid the groundwork for how we could incorporate bicycle and pedestrian safety into all our projects moving forward. In 2019 we released a phase 2 analysis with improved models and more years of data.
Our phase 2 bicycle & pedestrian safety analysis includes the following components:
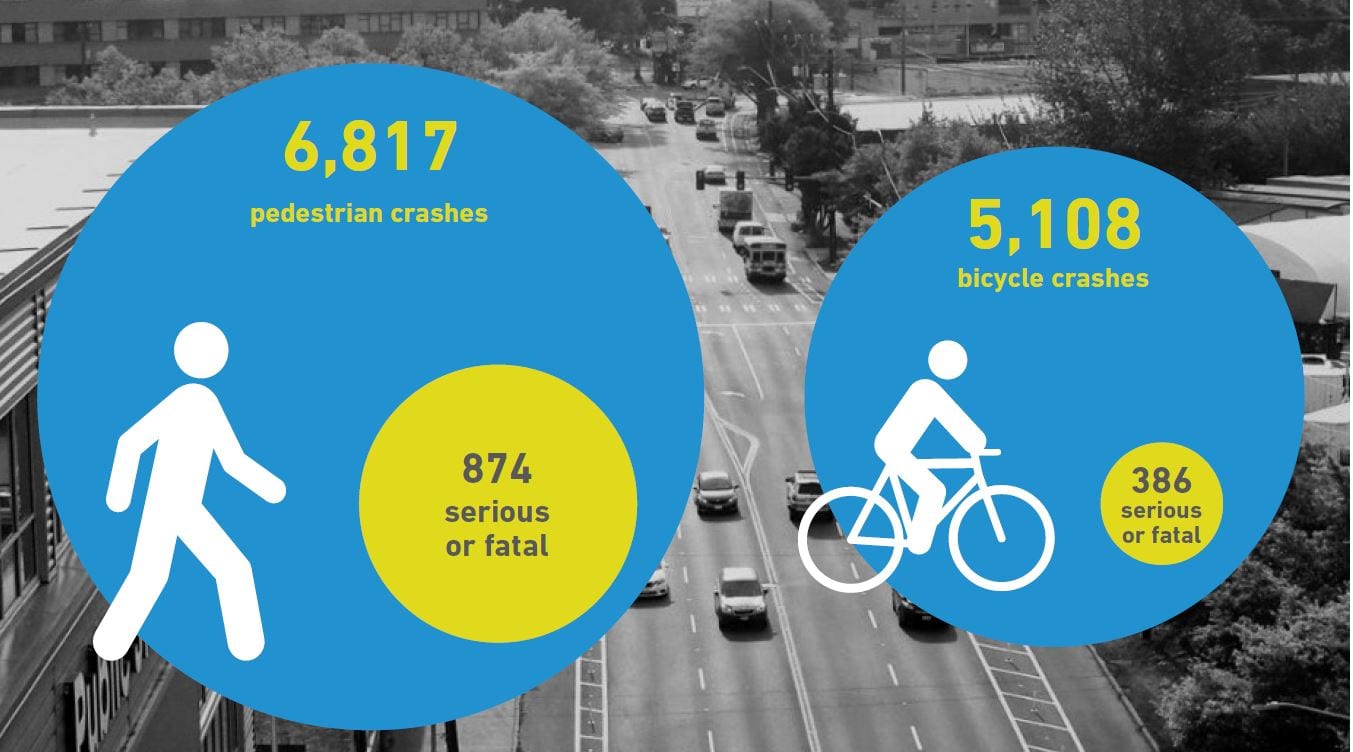
- 13 years of crash data between 2004 and 2017, totaling 6,817 pedestrian crashes and 5,108 bicycle crashes.
- Vastly improved pedestrian and bicycle “exposure models” estimating numbers of bikers, cars, and pedestrians, to help identify locations where use rates might contribute to collisions.
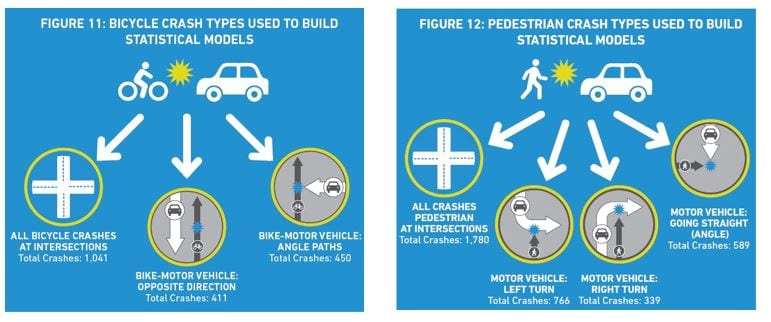
- Modeling of seven collision types to capture more bicycle and pedestrian patterns.
- Evaluation of different bicycle facility designs (protected bike lanes, sharrows, ect.) to observe near-miss incidents.
Key findings that have informed our Vision Zero priorities:
Two thirds of pedestrian & vehicle crashes in intersections involve a turning vehicle.
We found that two-thirds of pedestrians who were hit at intersections were hit by drivers turning left or right. We’re working to address this by changing traffic signals to give people a head start across the street, which makes them more visible and is proven to lower collisions with turning vehicles.
Higher speed limits, higher risk of left turn crashes with pedestrians.
We found that intersections with higher posted speeds limits have slightly more left turn-related crashes. This could have to do both with drivers making left turns at higher speeds and feeling greater “pressure” to make their turn, leading to rash gapfinding decisions. Higher speed limit segments are also likely correlated with higher motor vehicle volumes. We’re addressing this is by reducing speed limits across the city to 25 mph.
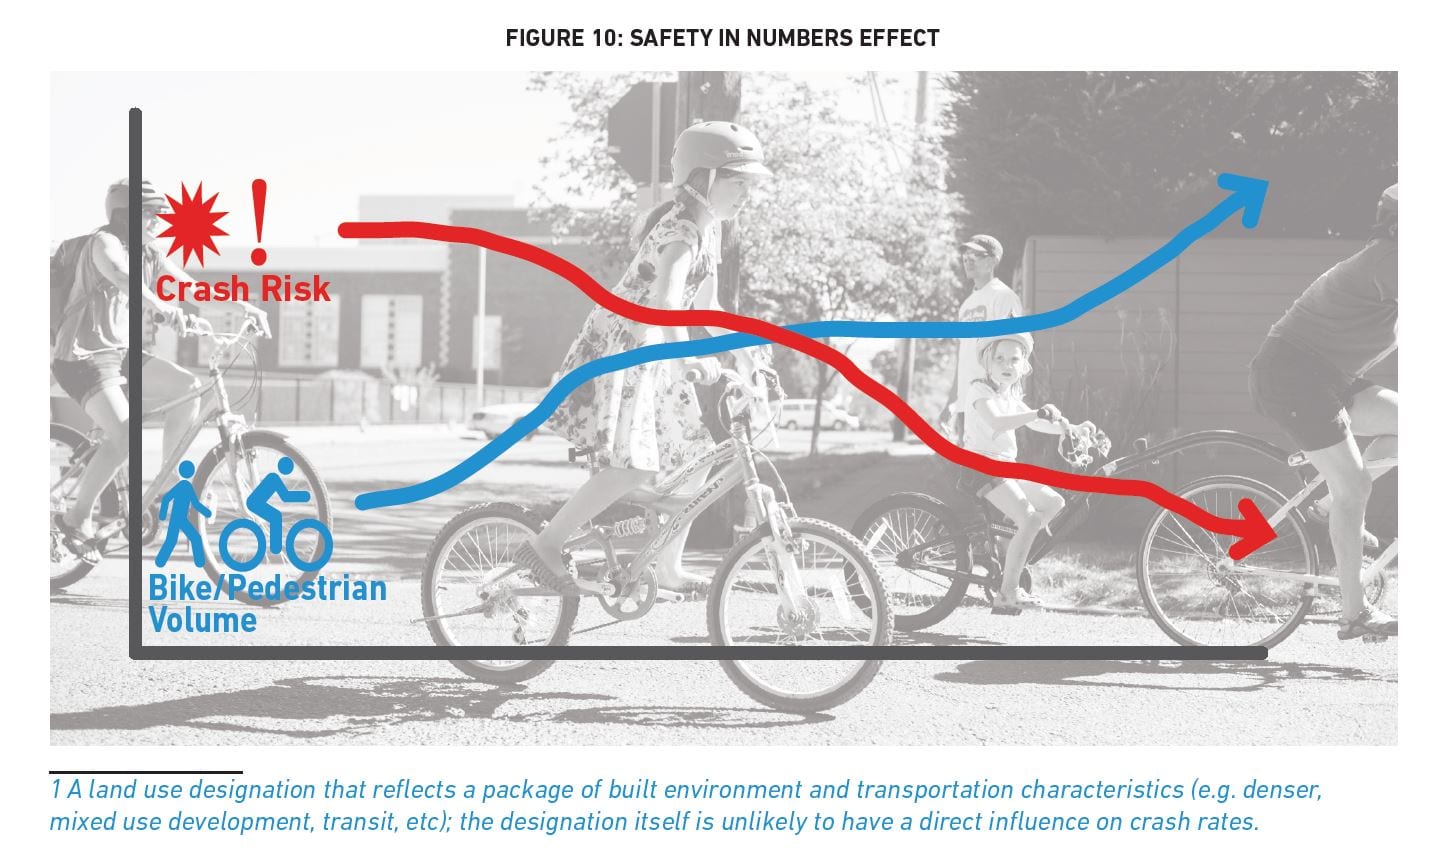
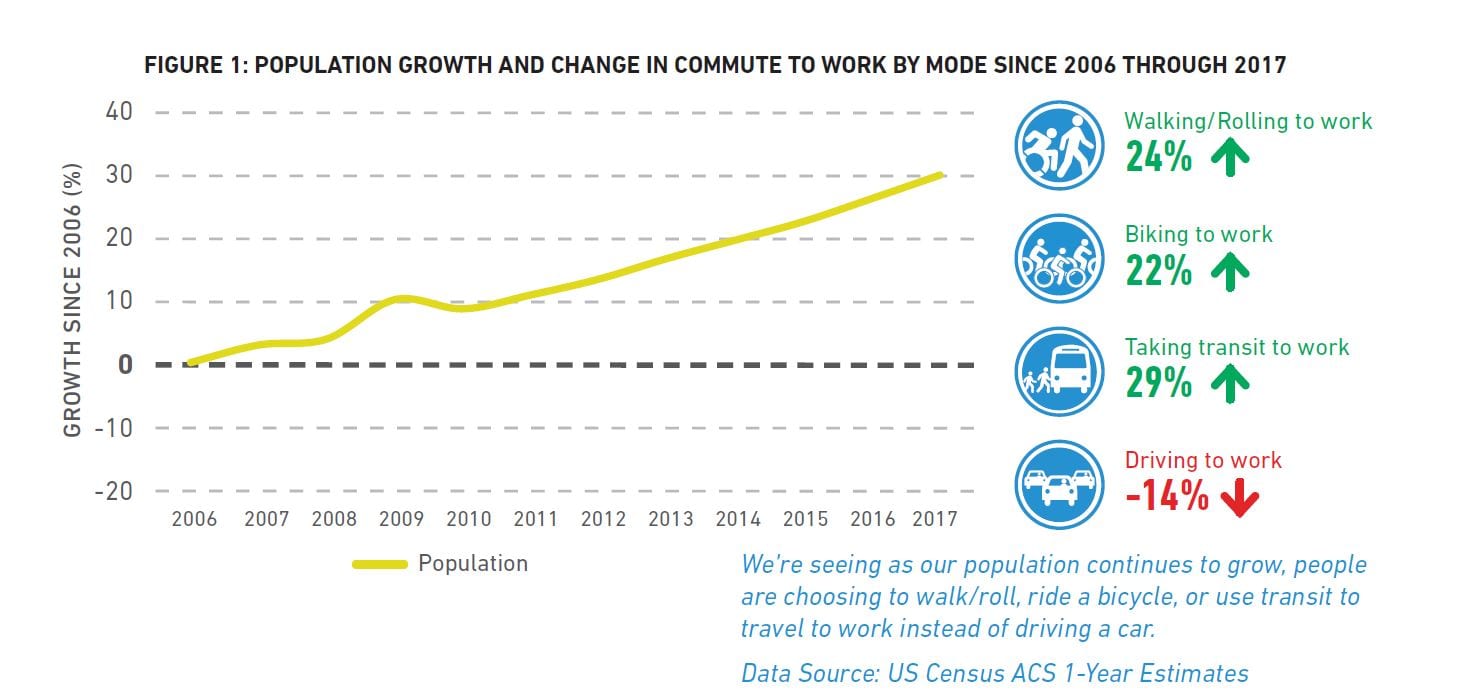
The more walkers, the lower rate of vehicle & pedestrian crashes
An important finding that was common to all walking models is that in areas with higher numbers of people walking, the crash risk per walking trip is lower. As we continue to grow as a city and more people walk to connect to transit and other daily needs, we’re glad to see that the number of crashes per walking trip is decreasing and the awareness of pedestrians increasing.