Every year, we release core data sets including traffic volumes, speeds, and collisions. Data drives our plans, policies, and decisions on everything from safety to paving. It also plays an important role in evaluating project performance and identifying trends.
Read the full Traffic Report to see 2018 transportation data and trends.
What does the data tell us?
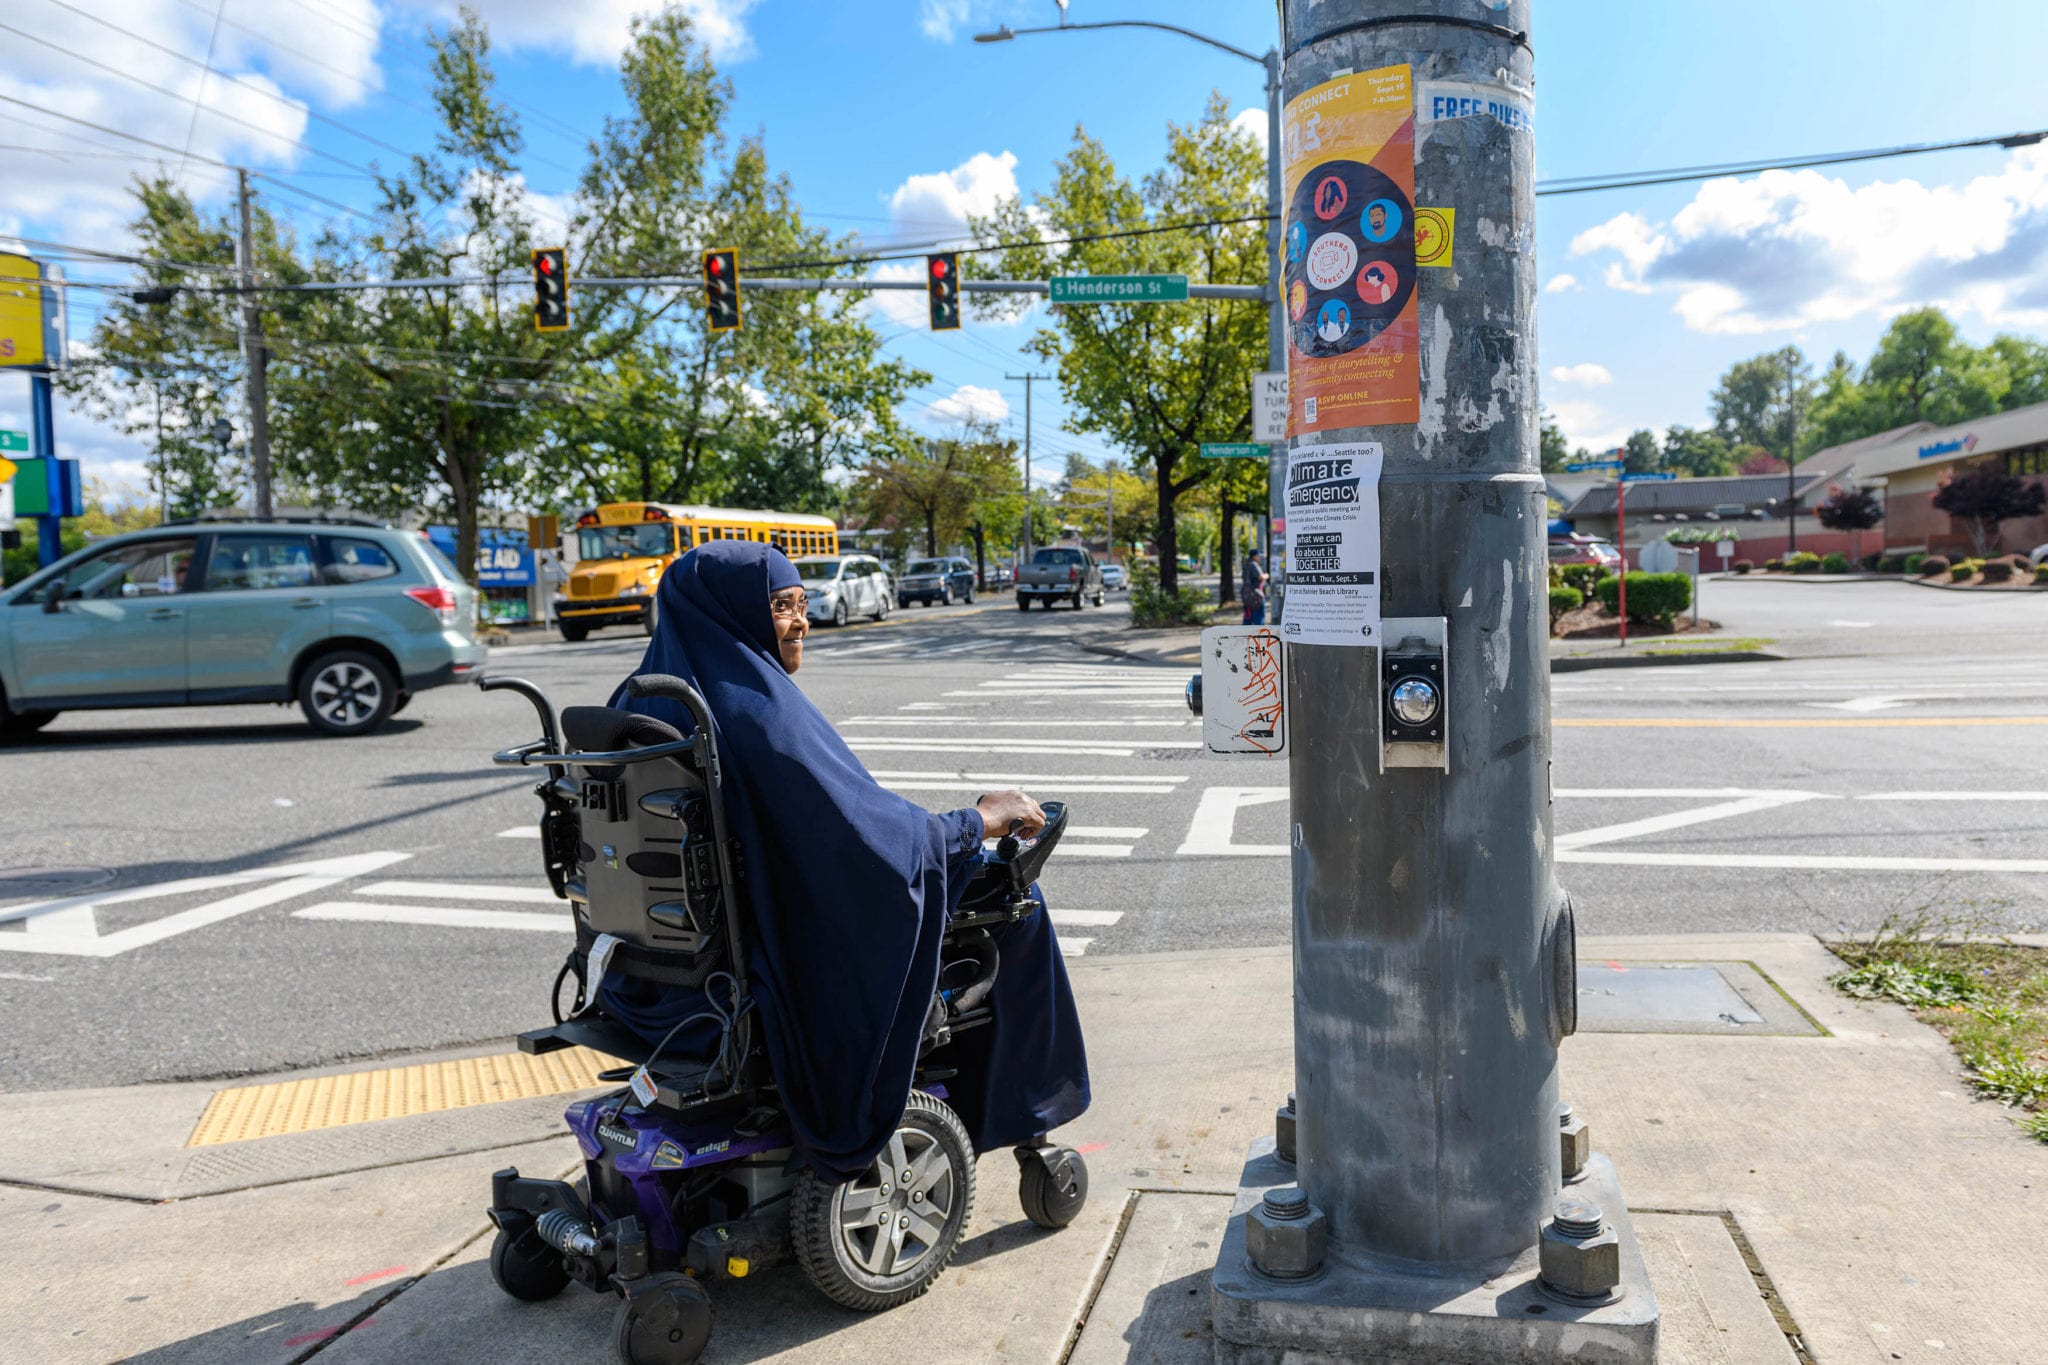
People are continuing to use a variety of healthy and active ways to get around Seattle as the population and economy booms.
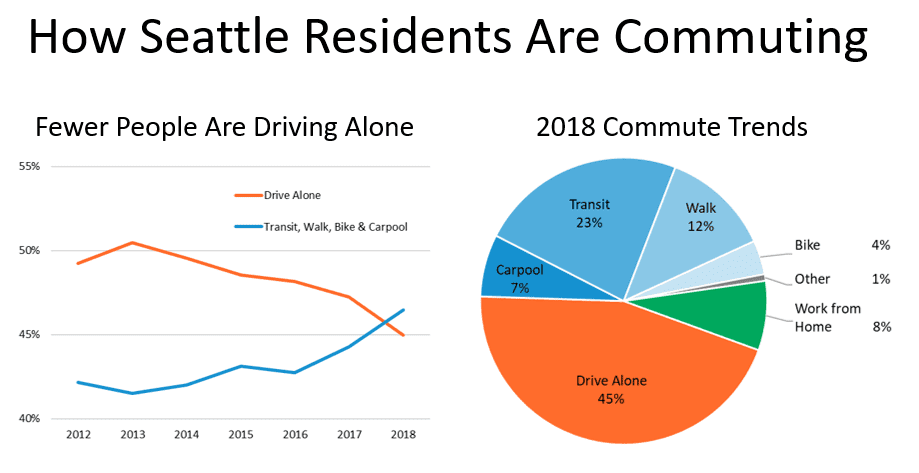
Keep up the great work Seattle! Only 45% of people commuted by driving alone. That’s a big drop from five years ago!
The number of people using active transportation in their commute increased, with 12.3% of people walking and 3.8% biking. We counted 19% more bikes passing data collection points around the city, and bike rides on the Fremont Bridge broke a 2014 record with 1,051,880 trips.
While we don’t have full 2019 numbers yet, we know that Seattle bike riders have continued to set new records all year long with massive ridership this winter, more people than ever riding shared bikes, and once again smashing the Fremont Bridge ridership record.
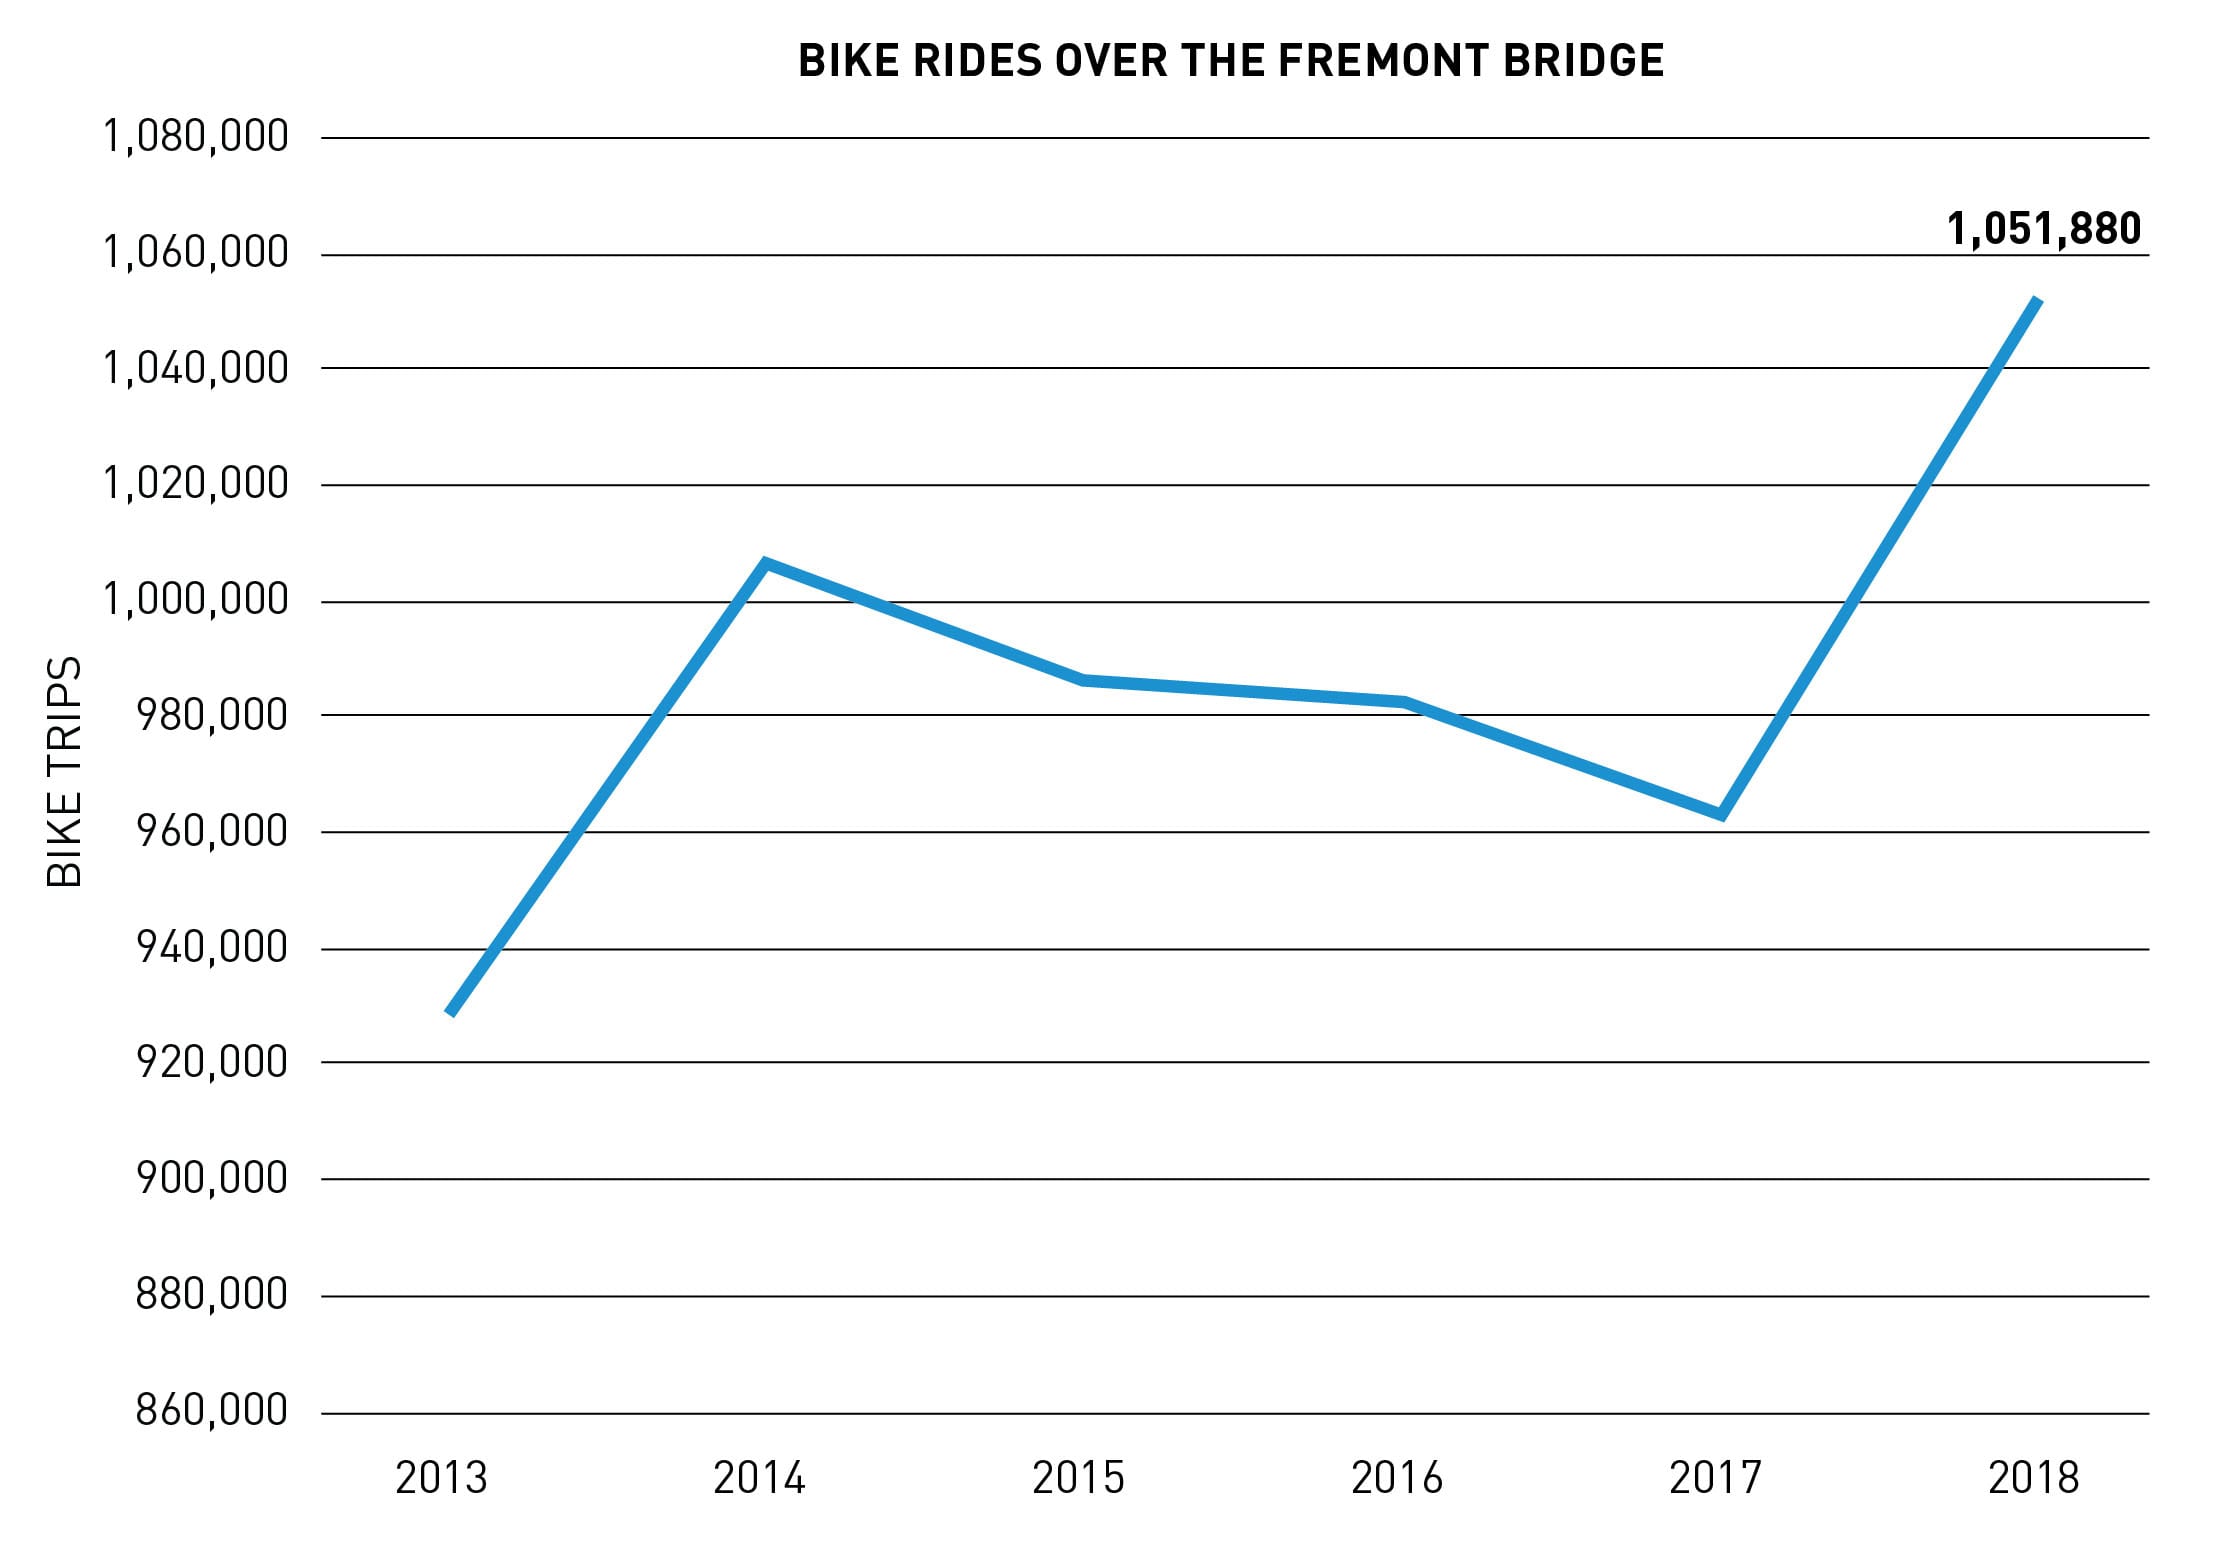
Increase in bike rides over the Fremont Bridge
In 2018, Seattle’s population grew by 2.3% to 730,000 people, employment increased to over 600,000 jobs in the city, and over 2 million jobs in the Puget Sound region. Even with a lower portion of people driving, the growing population and other factors have still led to a slight increase in driving overall.
On average, people took about 1 million car and truck trips in Seattle each day (including freeways), of which about 440,000 trips were on surface streets. This was a 3.6% increase from 2017, although the number of surface street trips was a little lower than 2016.
While Seattle has made national headlines for being one of the only cities to see ongoing increases in transit ridership, the 2018 report reveals that this trend might be beginning to level off. While 23% of Seattle residents say that they commute by transit, overall trips on transit only increased by about 1%. This is because transit remains an increasingly popular choice during peak commute times, but has not seen the same increases during off-peak times or weekends.
We are continuing to work with our transportation partners at King County Metro and Sound Transit to invest in improving transit reliability by adding over 8,000 weekly bus trips, 90 new blocks of red bus lanes, and providing free ORCA cards to 16,000 students and low-income residents through the voter-approved Seattle Transportation Benefit District and other funding sources.
Crash data emphasizes the importance of our Vision Zero plan
The report also includes a detailed look at citywide crash data from 2018. While there was a drop in Seattle traffic deaths in 2018, serious injuries increased moderately. Preliminary 2019 crash data, which is published in our 2019 Vision Zero update, indicates that traffic deaths and serious injuries have both increased this year.
In 2018, there were 12,185 crashes on Seattle streets, including 177 serious-injury crashes and 14 people who were killed. Pedestrians were the most vulnerable, and represented 9 of the 14 people who died after being hit by a car. Distraction was one of the most frequent contributors to crashes and was cited in nearly 2000 collisions. Intoxication was a factor in 489 crashes, a 19% increase from 2017.
Mayor Durkan recently announced a series of steps to improve safety on our streets and reaffirm the City’s commitment to achieving the Vision Zero goal of ending traffic deaths and serious injuries by 2030. We will be reducing the speed limit to 25 mph citywide, enhancing safety at traffic signals and crosswalks, and investing to make Seattle more walkable.
Why wait a year to release the report?
The traffic report is prepared in compliance with the Seattle Municipal Code, which requires the City Traffic Engineer to present an annual traffic report that incudes information about trends and collisions. We gather data throughout the year, but it takes time to process, double check, and analyze it all.
It takes a particularly long time to verify and analyze crash data. Initial police reports do not always tell the full story, so our preliminary data may change as it is reviewed for a variety of reasons. For example, people’s medical condition can change after the initial police report is filed, some crashes may not be reported at first, or further details may be revealed through a police investigation.
We work with Seattle Police Department (SPD) and the Washington State Department of Transportation (WSDOT) to review collision data over time. It typically takes about 2-3 months for WSDOT to review and process collision reports. We continuously update our public data portal as reports are processed, and publish a final report in December of the following year.
From data to action.
See how the data from the 2018 report is informing our plans and policies. Take a look: 2019 Vision Zero update, 2019 Bicycle Master Plan update, 2019 Pedestrian Master Plan update, Transit Master Plan, and Freight Master Plan.